npu-monitor: a system tray that knows what hardware each box actually has
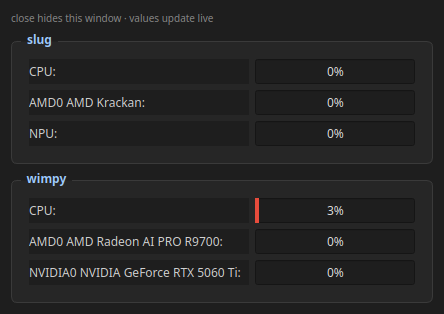
Every multi-host monitoring tool I tried assumed homogeneous hardware: one GPU, maybe two, same on every machine. My LAN doesn’t work like that — one box has an AMD APU iGPU plus a Ryzen AI NPU, another has an AMD R9700 and an NVIDIA RTX 5060 Ti. So npu-monitor treats the device list as dynamic: each host reports its own real silicon and the tray renders whatever arrives.
The numbers come from the actual kernel interfaces, not screen-scraping: ROCm sysfs (gpu_busy_percent) for AMD cards, nvidia-smi for CUDA, /proc/stat deltas for CPU, and a raw DRM_IOCTL_AMDXDNA_GET_INFO ioctl against /dev/accel/accel0 — using the real 168-byte sensor struct from the kernel UAPI — for the NPU’s utilization columns.
Features:
- KDE/X11 system-tray tooltip with live CPU + every GPU + optional NPU per host, polled every 2 seconds
- Double-click pop-out windows with live bar graphs per host, values rendered inside the bars
- Zero-config new hosts: each server advertises itself over mDNS (
_gpu-monitor._tcp) via avahi; the tray discovers it live, no restart, no config edit - Hostname-derived identity dedupes
wimpy/wimpy.local/wimpy.home.laninto one entry - Server side is stdlib-only Python — no pip install on monitored machines
- Every poll appends to a long-format CSV (timestamp, host, device, util) locally and on the desktop
- APU iGPUs are dropped when a discrete GPU is present, so the list stays meaningful
--headlessmode still polls, logs, and prints — for boxes without a GUI session
Source: github.com/rahlquist/npu-monitor · MIT licensed.